As all of you have witnessed to this point in the season,
Jason Bay hasn't been, well Jason Bay this year. He has only six homers thus far in 2010, a little less than a third of the amount he had last year at this same time. There are a few elements in Jason Bay's game that are uncharacteristically different this season and might be attributable to a new team philosophy focusing on putting more balls in play equating to fewer strikeouts and fewer walks. The
Mets have a paltry team wide BB/K rate of .44 (9th worst in the majors) and an O-Swing rate (swinging percentage on balls out of the strike zone) of 31.9% good for second to last in the majors. When plate discipline becomes a team wide weakness one should attribute such failures to non other than the hitting coach. Swinging at balls is not the right approach if the Mets want to win baseball games. Anyways, back to Jason Bay.
When you compare Jason Bay's 2010 stat line to that of his 2009 one, you'll find three big differences. His homers, his walks and his strikeouts. Jason Bay has altered his hitting program (I'm looking at you Mr. Johnson) which entails him putting many more balls in play instead of being the high walk and high strikeout rate power hitter he has always been. While watching Saturday's Mets game against the
Dodgers I noticed something about Bay I had never noticed before. Both his singles were groundballs pulled through the 5-6 hole. It dawned on me. Had Jason Bay been hitting lots of groundball singles to his pull field and fewer fly balls? I quickly went to the invaluable FanGraphs website and checked if I had gone crazy or if my
gut was onto something. Lo and behold my gut was right.
|
|
|
|
|
|
|
|
|
|
|
|
|
|
|
| 2009 | as R to Left | 0.0 % | 0.0 % | 0.00 | .441 | .912 | 1.353 | .466 | .363 | 61.7 | 38.3 | .566 | 254 |
| 2009 | as R to Center | 0.0 % | 0.0 % | 0.00 | .342 | .670 | 1.011 | .322 | .294 | 23.0 | 9.0 | .421 | 159 |
| 2009 | as R to Right | 0.0 % | 0.0 % | 0.00 | .267 | .533 | .800 | .267 | .214 | 7.7 | 0.4 | .337 | 103 |
|
|
|
|
|
|
|
|
|
|
|
|
|
|
|
| 2010 | as R to Left | 0.0 % | 0.0 % | 0.00 | .360 | .439 | .798 | .079 | .354 | 15.8 | 2.5 | .351 | 120 |
| 2010 | as R to Center | 0.0 % | 0.0 % | 0.00 | .406 | .681 | 1.087 | .266 | .394 | 21.7 | 10.5 | .460 | 193 |
| 2010 | as R to Right | 0.0 % | 0.0 % | 0.00 | .196 | .531 | .727 | .327 | .146 | 4.7 | -1.3 | .293 | 81 |
If you look at his numbers to each field you'll notice that the only big difference is to his pull field, while centerfield and rightfield have essentially stayed the same. Jason Bay's
wRC+ has dropped an astounding 134 points while his
wOBA is also down a ton. While the drop in OBP is nothing to sneeze at, the drop in ISO (Isolated Power) is frightening. Let's look at Jason Bay's batted balls to try to get a better picture.
|
|
|
|
|
|
|
|
|
|
|
|
|
|
| 2009 | as R to Left | 1.65 | 22.6 % | 48.2 % | 29.2 % | 3.5 % | 42.1 % | 9.6 % | 0.0 % | 629 | 216 | 413 |
| 2009 | as R to Center | 0.29 | 13.7 % | 19.7 % | 66.7 % | 9.0 % | 10.3 % | 8.7 % | 0.0 % | 375 | 118 | 257 |
| 2009 | as R to Right | 0.15 | 9.8 % | 11.5 % | 78.7 % | 20.8 % | 8.3 % | 0.0 % | 0.0 % | 224 | 82 | 142 |
|
|
|
|
|
|
|
|
|
|
|
|
|
|
| 2010 | as R to Left | 3.35 | 23.7 % | 58.8 % | 17.5 % | 0.0 % | 5.0 % | 16.4 % | 0.0 % | 359 | 109 | 250 |
| 2010 | as R to Center | 0.45 | 19.8 % | 25.0 % | 55.2 % | 1.9 % | 3.8 % | 4.2 % | 0.0 % | 313 | 106 | 207 |
| 2010 | as R to Right | 0.04 | 7.8 % | 3.9 % | 88.2 % | 22.2 % | 6.7 % | 0.0 % | 0.0 % | 174 | 59 | 115 |
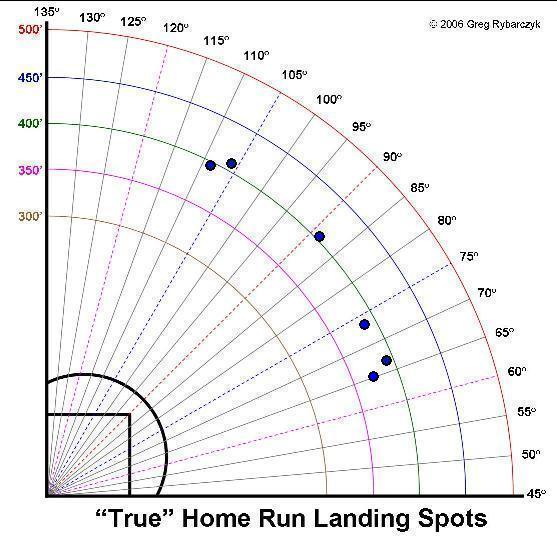
Wow. Jason Bay has morphed into Luis Castillo, pounding 58.8% of his pulled batted balls into the ground. About 10% of his flyballs to leftfield have turned into groundballs which is awful and can help explain his loss in homeruns. The more flyballs a hitter hits, the more extra base hits and homeruns he'll have. Jason Bay, being a pull hitter, has to raise that FB% to leftfield back up to around 30% if he wants to get his power back. But something else is also manifesting itself in these numbers. It looks like Jason Bay just isn't hitting the ball with as much authority as he was last year. If you look at his HR/FB% you'll notice the crazy 37% drop. Can this be attributed solely to luck or is there something else going on here? Jason Bay is probably suffering from some kind of combination of not hitting enough flyballs along with not hitting the ball as far, playing in Citi Field as opposed to Fenway Park and some tough luck. Here are a couple graphs from TexasLeaguer.com and a couple from HitTrackerOnline.com hat will hopefully help us come to a conclusion. (2009 on left, 2010 on right)


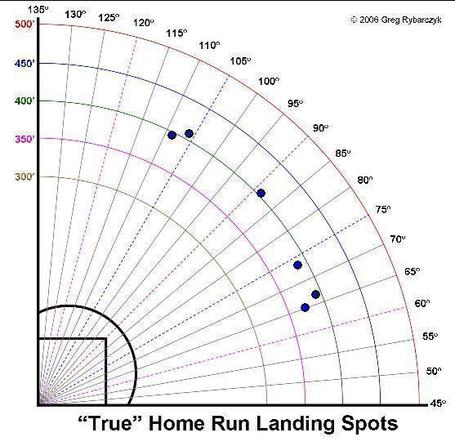
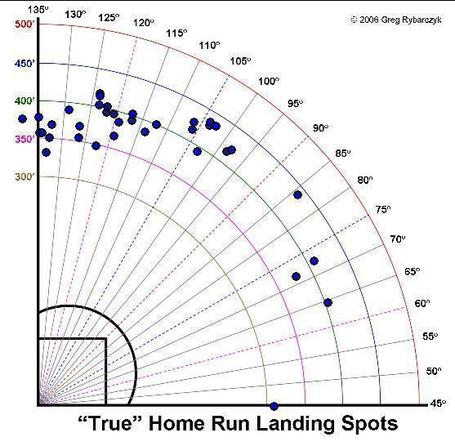
Where the 2009 data has a large cluster of light green (denoting a hit) in deep leftfield the 2010 data has an empty space of dark green (denoting unoccupied space on the spray chart). This supports Jason Bay's extremely low HR/FB% this season, Jason Bay just isn't hitting the ball as hard as he was one season ago. Last season, being a power and a pull hitter, Jason Bay hit the vast majority of his home runs to leftfield. This season three of his six homers have been hit to rightfield. Also, as shown on Greg Rybarczyk's website Hit Tracker Online, Jason Bay's "average speed of bat" for his home runs have decreased on average by 2.2 MPH. I don't know if this is siginificant but it still sheds some light on our Jason Bay dilemma. So now that it is pretty clear that Jason Bay is hitting the ball with less authority this season after hitting 36 homers last season, the question is why'd he change his approach? After all the famous mantra states "if it ain't broke don't fix it". So why did Jason Bay try to fix a non-existent problem? We can theorize all day long. One possibility is that he was scared he wouldn't be able to produce big enough power numbers given the fact that Citi Field suppresses the home run, or it could be Howard Johnson got to him (see Wright, David 2009), or it could be something else entirely. The question I want to answer is how did this happen?
|
|
|
|
|
|
|
|
|
|
|
|
| 2009 | Red Sox | 20.1 % | 63.1 % | 40.7 % | 48.5 % | 79.4 % | 71.5 % | 47.9 % | 57.6 % | 11.3 % |
| 2010 | Mets | 27.0 % | 65.6 % | 45.7 % | 57.8 % | 81.0 % | 73.9 % | 48.4 % | 57.6 % | 11.7 % |
As shown on the graph, Jason Bay has not only increased his O-Swing rate by 7% he has also increased his O-Contact rate by 9%. So while Jason Bay is making more contact in 2010, he is making weaker and poorer contact. Weak, poor contact generally leads to soft hit groundballs, so this looks to be the reason for the increase in GB% to Jason Bay's pull field, leftfield. This has led to a lower flyball rate to leftfield, his power field, which has effectively lowered Bay's power production to his pull field, thus leading to many fewer homeruns. So as you can see, everything in baseball can be traced back to plate discipline. The difference between the power hitting Jason Bay and the slap hitting Jason Bay is essentially taking seven more pitches thrown outside the strike zone every hundred pitches. These few pitches afford him the opportunity to wait for a pitch to drive and hit a flyball off of, equating to more home runs, instead of going out of the strike zone and making poor contact and hitting more groundballs. These slight changes for Jason Bay could be the difference between the power hitting, high OBP monster and the slap hitting 2010 version the Mets got. So Jason, try to be more patient, wait for your pitches and make sure to hit lots of flyballs to leftfield, even if it means striking out more. Oh, and for the future don't listen to Howard Johnson.
REFERENCES
-Fangraphs.com (the tables)
-TexasLeaguer.com (the balls in play spray charts)
-HitTrackerOnline.com (the home run spray charts)